 Specialty Casters
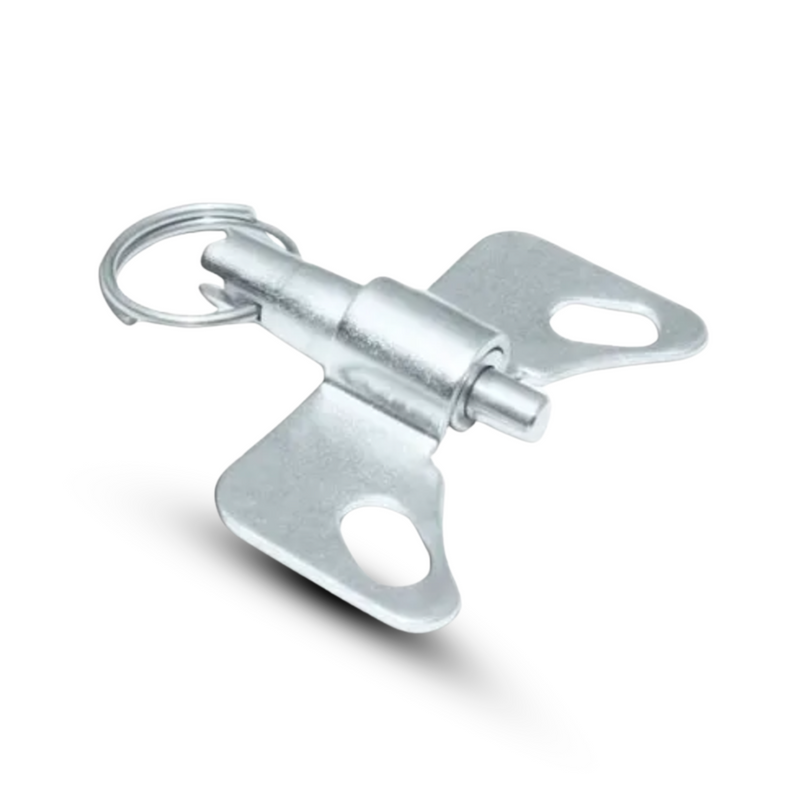
 Gate Casters
 BBQ Pit & Smoker Casters
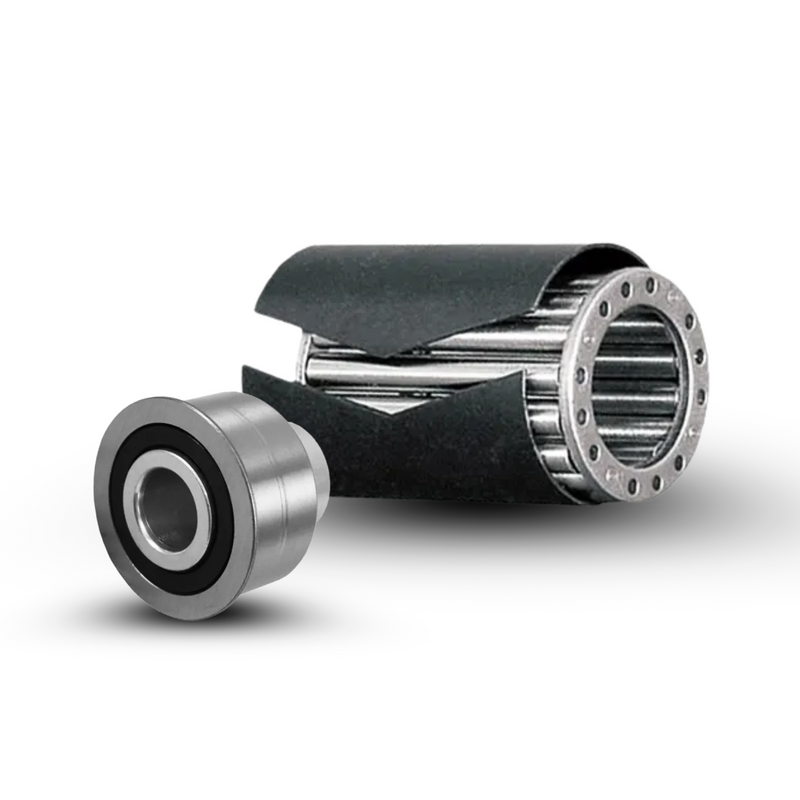
 Keyed Drive Wheels
 Drywall Cart Casters
 Skid Wheels & Casters for RVs
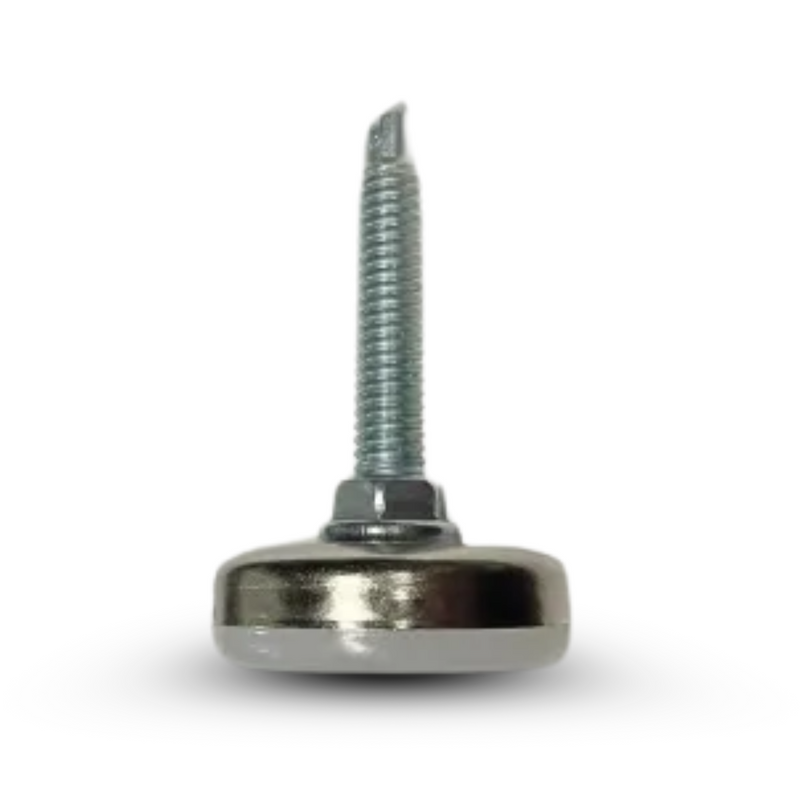
 Leveling Casters
 Shopping Cart Wheels & Casters
 Band Equipment Casters & Wheels
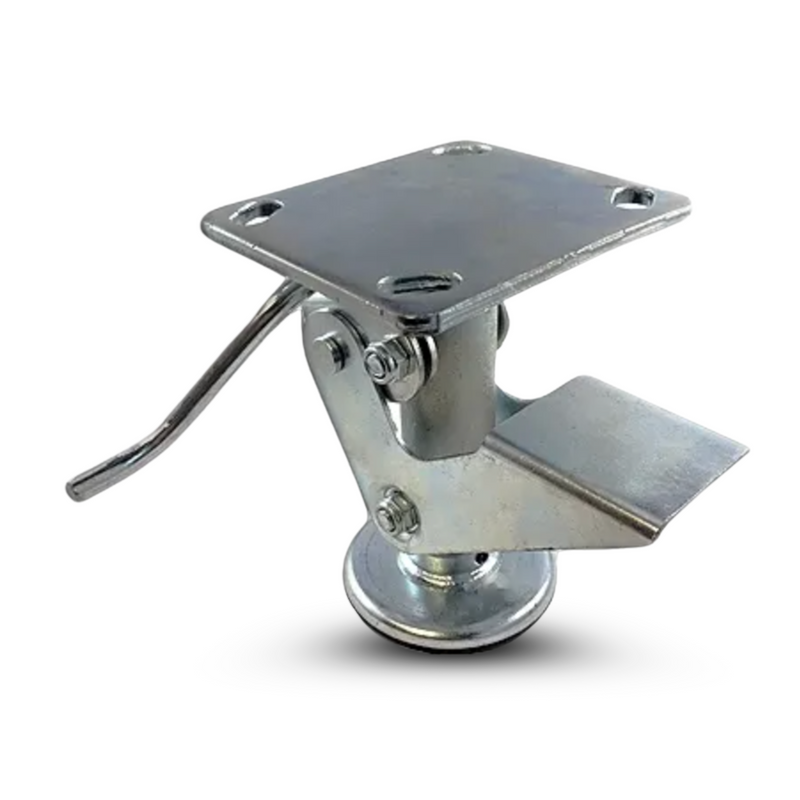
 Low Profile Casters
 Cart Wheels & Casters
 Toolbox Caster Sets
 Bakery & High Temperature Casters
 Kitchen Prep Table Caster Sets
 Wire Shelving Casters
 Silent Glide Casters


The purchase price of a caster is usually the smallest part of what it costs you. On a multi-shift cart fleet, replacement labor and unplanned downtime routinely cost more than the casters themselves. This tool compares the true annual cost of your current spec against a longer-life premium spec, then returns the payback period and 3-year savings so you can defend the spec decision with a number.
Caster total cost of ownership (TCO) = the amortized purchase cost + the labor to replace worn or failed casters + the downtime caused by failures, measured over the fleet's service life. A caster that costs twice as much but lasts three times as long and fails far less often almost always wins on TCO, because parts are a minority of the lifetime cost. The exception is low-duty fleets that rarely fail, where the cheaper caster is the correct buy. This calculator shows which case you are in.
Enter your numbers. Everything recalculates instantly. Defaults are an illustrative 20-cart fleet, not a quote.
Downtime cost is facility-specific. Use your own number for a line stoppage, a delayed shipment, or idle labor waiting on a stuck cart. Leave it at 0 to compare parts and labor only.
Three cost buckets decide caster TCO. On light-duty, low-failure fleets the purchase price dominates and the cheap caster wins. On multi-shift, heavy, or high-failure fleets, labor and downtime dominate and the engineered caster wins. The calculator above is just these three lines added up for each spec.
| Cost driver | What it is | When it dominates |
|---|---|---|
| Parts | Amortized purchase cost of casters bought per year to keep the fleet running | Light duty, long life, rare failures |
| Labor | Maintenance time to remove and install replacements, at your loaded rate | Large fleets, frequent swaps, hard-to-reach mounts |
| Downtime | Lost output or idle labor when a caster seizes, flat-spots, or sheds a tread mid-shift | Continuous production, line-side carts, AGV/tow trains |
For each spec, annual cost is the sum of three lines:
Total casters = carts × casters per cart
Casters replaced per year = total casters ÷ (service life months ÷ 12)
Parts/yr = casters replaced per year × unit price
Labor/yr = casters replaced per year × labor hours per swap × labor rate
Downtime/yr = (carts × failures per cart per year) × downtime hours × downtime $/hr
Annual cost = Parts/yr + Labor/yr + Downtime/yr
Savings/yr = current annual cost − premium annual cost.
Payback = the one-time cost to re-spec the whole fleet now, total casters × (premium price − current price), divided by monthly savings. If the premium spec is cheaper to buy, payback is immediate.
Net 3-year impact = three years of savings minus that one-time re-spec cost.
Assumptions: steady-state replacement (the fleet is kept running, so casters are bought as they wear out), labor and downtime rates are the same for both specs because they are properties of your facility, and the premium spec earns its keep only through longer life and fewer failures. This is a planning estimate, not an accounting figure. Use your own numbers.
A 20-cart line fleet, 4 casters each, runs budget casters at $18 that last 18 months and fail unexpectedly about 1.5 times per cart each year. Switching to a $34 engineered caster that lasts 60 months and fails 0.3 times per cart per year cuts replacement purchases by roughly 70 percent, slashes swap labor, and removes most downtime events. At a $45 loaded labor rate and $250/hr downtime, the premium spec is dramatically cheaper per year despite costing nearly double up front. The default values in the tool reflect this example. Change them to match your floor.
If your carts are light-duty, move occasionally, and almost never fail, the calculator will show little or no savings. In that case the cheaper caster is the right buy and we will tell you so. The point of this tool is to make the correct spec decision on the numbers, not to push the expensive part. Spend the budget where the failures actually are.
Send us the load, floor, duty cycle, and cart count. We will quote the longest-life caster that fits, not the cheapest line item.
Request a Quote →It is the amortized purchase cost plus the labor to replace worn or failed units plus the downtime those failures cause, measured across the fleet's service life. On multi-shift fleets, labor and downtime usually exceed the purchase price, so the lowest-priced caster is rarely the lowest-cost caster.
A lower-grade wheel and bearing wear faster and seize more often. Each replacement carries maintenance labor, and each unplanned failure can stop a cart or a line. Multiply those events across a fleet and a year and the cheaper caster generates more total cost than a longer-life engineered caster, even though its sticker price is lower.
Divide the total casters in service by the service life in years to get casters replaced per year, then multiply by unit price for parts and by labor hours and labor rate for swap labor. Add the downtime cost of unplanned failures. The calculator above does this for both your current and a premium spec.
When the longer service life and lower failure rate save more in replacement labor and downtime than the higher purchase price costs. That is almost always true on continuous-duty, heavy, or line-side fleets and often false on light-duty fleets that rarely fail. Enter your numbers to see which case applies to you.
It is facility-specific. A seized caster that stops a production line costs far more per hour than one on a stockroom cart. Use your own figure for lost output or idle labor per hour of stoppage. If you cannot estimate it, set downtime cost to zero and the tool compares parts and labor only.
Built and reviewed by Bob Camp, Director of Caster Sales, drawing on 45+ years in the caster industry specifying for aerospace, defense, and heavy manufacturing fleets.
Methodology & references: Steady-state replacement cost model (see formula above). Ergonomic and failure-cost rationale aligns with OSHA guidance on pushing and pulling and the Liberty Mutual / Snook manual materials handling tables. Downtime and labor rates are user-supplied and facility-specific.
Updated June 14, 2026 · CasterHQ, Mansfield, TX · 844-439-4335


